When I teach how to analyse fisheries data in my PhD course "Advanced Fisheries Data Analysis and Modelling with R", I set aside extra time for two topics. The first is artificial intelligence and machine learning; the second is spatial, temporal and Bayesian modelling. I brought together the material I prepared for the course on these two topics in two book chapters. The two chapters came out in October 2026 in Ziraat, Orman ve Su Ürünleri Alanında Güncel Gelişmeler ve Tematik İncelemeler, a book published by Platanus Publishing.
I built both chapters the same way. I first explain why each method is needed, then show it with an example in R that runs from start to finish. The data in the examples are simulated data that I generated with set.seed(). I chose this route so as not to share raw data, but I built each simulation on the structure of a real study we carried out in the Aegean: the purse seine fishery in İzmir, Aegean trawl discards, blue crab (Callinectes sapidus) pots in Azmak Stream and the eastern Mediterranean bluefin tuna (Thunnus thynnus) fishery. Anyone who runs the code on their own computer gets exactly the results in the chapter.
Machine learning doesn't automatically beat classical models
In the first chapter I compared machine learning methods such as random forests and boosted regression trees with the classical models we have used in fisheries for years, on the same data. Each time I measured performance with cross-validation, that is, by how well the model predicts data it has not seen.
In the CPUE example based on the İzmir purse seine fishery, the prediction errors of the methods were almost identical, and the classical GLM gave the lowest error. In the trawl discard example, GAM and the two tree methods were again neck and neck. In the blue crab pot example, when classifying "high catch" sets, logistic regression (AUC 0.76) finished slightly ahead of the random forest (0.72).
The main message of the chapter is this: machine learning is not an advantage that replaces classical statistics, but a tool that complements it. When the data have a well-behaved structure, a well-built GLM or GAM predicts at least as well, and it also shows the effect of each variable in a readable way. Machine learning makes its real difference when variables interact in complex ways, when we don't know the shape of the relationship, or when we work with high-dimensional data such as images.
Using the two approaches side by side has another benefit. In the purse seine example, the GLM found sea surface temperature non-significant, while the random forest ranked it as the second most important variable after chlorophyll-a. At first sight this looks like a contradiction. In fact, temperature affects the catch not directly but through its strong relationship with chlorophyll-a. Once the GLM accounts for chlorophyll, temperature has nothing left to explain; the random forest reflects this indirect information in its importance ranking. Looking at both together lets us read the relationship more accurately.
Large language models speed things up but need oversight
In the last part of the chapter I covered large language models such as ChatGPT and AI agents that can write and run code. In the study by Brown and colleagues published in 2026, an AI agent was given modelling tasks that are common in fisheries science, such as fitting a growth curve. The agent completed the tasks correctly in some trials, but its results varied from trial to trial.
In the study I carried out with F. Ozan Düzbastılar we saw a similar picture. We asked ChatGPT 50 questions about artificial reefs, and five experts scored the answers. The suitability of the answers varied markedly with the prompt used; expert scores stayed slightly above the midpoint of a seven-point scale. The two studies lead to the same conclusion: in the hands of someone who knows the subject these tools speed up the work, but left unsupervised they become unreliable. This is why in the chapter I recommend that no AI output feeding into a management decision be used without expert oversight and independent verification.
Fisheries data are not independent
The second chapter deals with a question that machine learning often leaves in the background: how far can we trust an estimate? Observations from neighbouring stations, consecutive years or the same vessel resemble each other. When classical regression treats them as independent, we act as if we had more information than we do. Confidence intervals become narrower, and an effect that is not really significant can look significant.
The chapter opens with a multivariate analysis comparing the species composition of coastal and offshore stations; in this example, depth is the main factor separating the two communities. I then move on to the abundance of a single target species. In the simulation based on the purse seine fishery, I showed that the errors of an ordinary model are not randomly distributed on the map but cluster in certain areas. When I added location to the model, the explained deviance rose from 11.5% to 85.1%. The uncertainty around the effect of sea surface temperature also grew, because once space is accounted for, uncertainty is estimated more honestly.
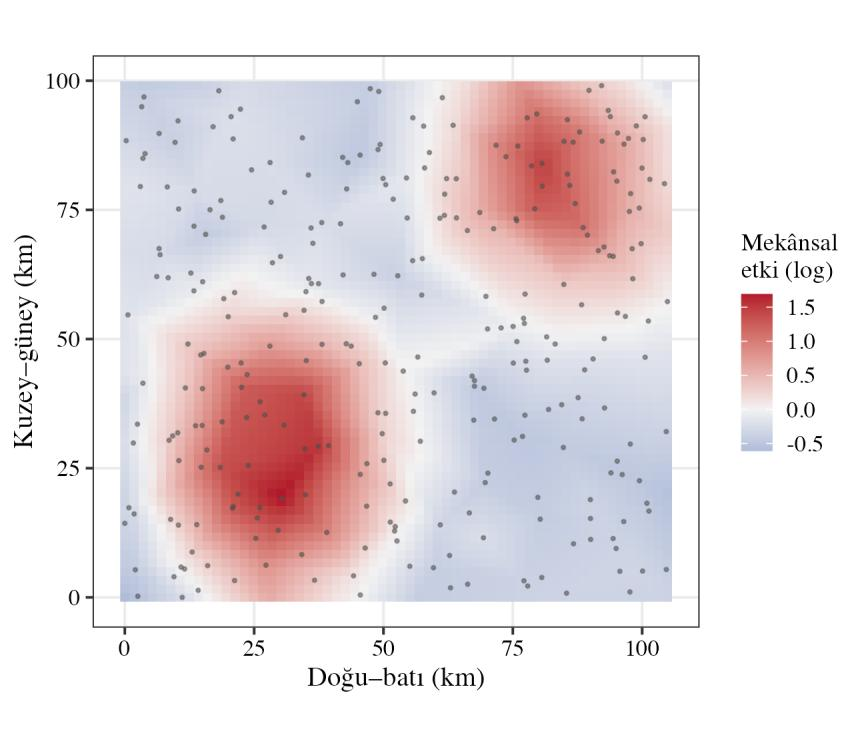
In the next step I built a spatial random field with the sdmTMB package. The model clearly revealed the two high-yield fishing grounds in the simulation.
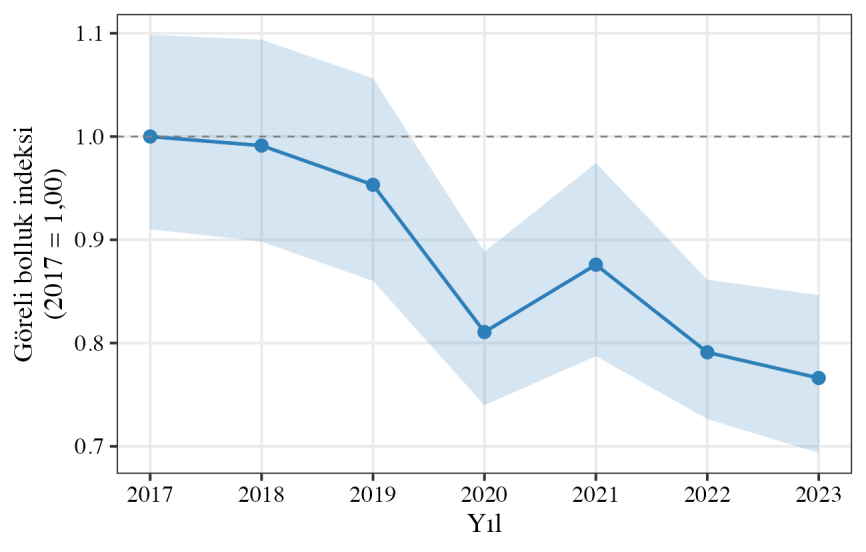
The main product of this model is a yearly abundance index cleaned of where sampling took place. If one year's fishing happened mostly on productive grounds and the next year's mostly on poor grounds, the raw CPUE average shows this difference as a change in abundance. Because the index makes each year's prediction over the same grid and under average environmental conditions, it corrects this bias. In the simulation the index fell by about 23% from 2017 to 2023, and each year was reported with its own confidence interval. This direction matches the decline that Balkı and colleagues and I found in the İzmir Bay purse seine fishery in 2025. This is exactly the kind of series we want from an abundance indicator that will feed into stock assessment.
The language of probability is closer to management
The last application in the chapter is a Bayesian hierarchical model. I added twenty vessels to the simulated data and modelled the differences in their fishing power as a random effect. The Bayesian approach gives the result directly as a probability. Instead of asking "is the effect of 2023 statistically significant?", we can ask "what is the probability that there was a decline in 2023 compared with 2017?". The model's answer was about 87%. For a decision maker, this sentence is much easier to understand than a p-value.
Because this model has no spatial field, the variability coming from location mixes into the error and the intervals of the year effects widen; most of them cross zero. This shows that the methods are strongest not as substitutes for one another but when used together. Multivariate analysis defines which species and areas we treat together, the spatial model produces an abundance signal cleaned of sampling effects, and Bayesian inference turns the uncertainty of that signal into probabilities a decision maker can use.
What don't we know yet?
There is no rule that tells us in advance which method will win. The choice between machine learning and classical models depends on the structure of the data and on the question being asked, and it has to be tested again in every study. The fact that large language models don't give the same answer to the same question every time is also not yet a solved problem for scientific reproducibility.
No model can fix bad data. Wrong position records, inconsistent effort definitions or selective sampling will mislead even the most advanced model. Modelling does not replace good data; it only lets us extract more information from it.
Both chapters are in Turkish:
Ceyhan T (2026). Balıkçılıkta yapay zekâ ve makine öğrenmesi uygulamaları: R ile kavramlar, yöntemler ve örnekler [Artificial intelligence and machine learning applications in fisheries: concepts, methods and examples with R]. In: İ. Daşdemir, N. Ersoy (Eds.), Ziraat, Orman ve Su Ürünleri Alanında Güncel Gelişmeler ve Tematik İncelemeler (pp. 31-66). Ankara: Platanus Publishing. ISBN 978-625-6517-39-4.
Ceyhan T (2026). Balıkçılıkta mekânsal, zamansal ve Bayesçi modelleme: R ile kavramlar, yöntemler ve örnekler [Spatial, temporal and Bayesian modelling in fisheries: concepts, methods and examples with R]. In: İ. Daşdemir, N. Ersoy (Eds.), Ziraat, Orman ve Su Ürünleri Alanında Güncel Gelişmeler ve Tematik İncelemeler (pp. 217-242). Ankara: Platanus Publishing. ISBN 978-625-6517-39-4.